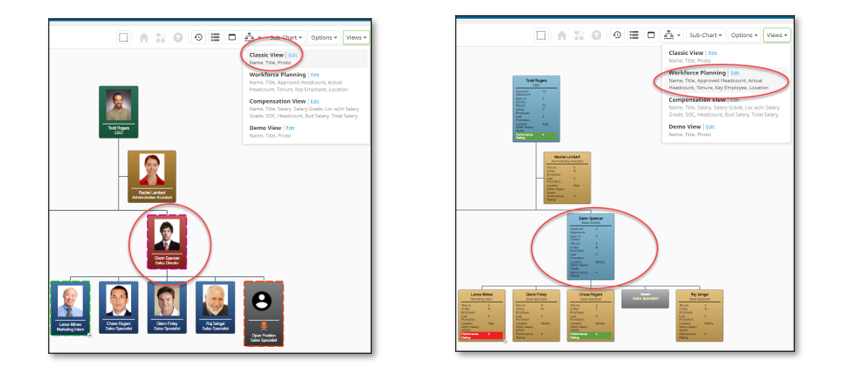
What are views?
Insperity® Organizational Planning allows administrators to create different views of their chart. Views display different information on the boxes, different colors of the boxes, and highlights to call out different data points. In addition, different profile cards can be assigned to views, proving data points relevant to the view’s purpose.
Views control:
- Profile headers/bodies
- Colors of the boxes
- Fields included in each box
- Highlights around the box
- Highlights on fields within the box
- Sort order of the boxes
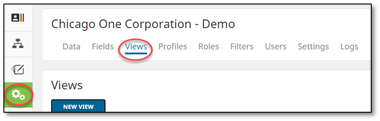
Creating/editing a view
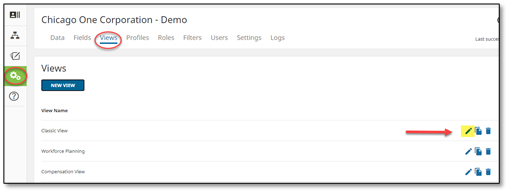
To create a new view or edit an existing view, navigate to Administration > Views.
Create a new view
To create a new view, select New View. Enter the name of the new view. Once your view has been created, a default view will populate and you can begin editing the view.
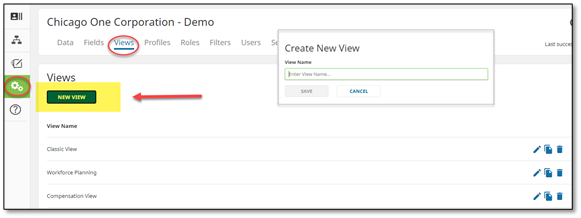
Edit an existing view
To edit a view from the views list, select the Edit icon to the right of the view you would like to modify.
Overview of a Views Module
Once you have entered the views design module, you will see 4 quadrants that have different areas of functionality:
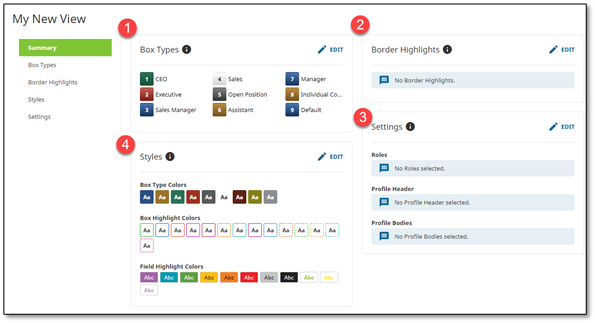
- Box Types: Box types are configured to determine who gets what box style and what that box style has on the face of the box. For example, a manager would get a box that displays additional information about their team whereas a non-managers box would only display information about themselves.
- Border Highlights: Applying border highlights to the view allows boxes that meet certain criteria (Part-time employees, temporary employees…) to display color and/or dotted border around the box.
- Settings: This area allows profile cards to be assigned as well as roles that are allowed to have access to this role. Other options include adding a description to the view and allowing a sort order to apply to the boxes.
- Styles: Styles allow you to make custom colors to the box types, borders, and field highlights. In this section, you can also adjust the width of the boxes and the layout of the employee photos within the box.
Setting up your Box Types
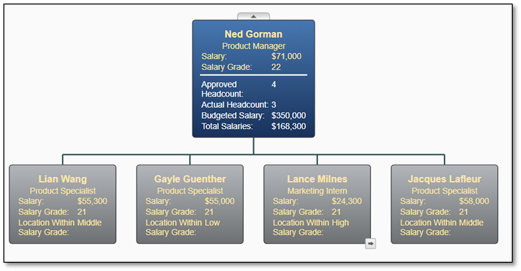
Box Types allow you to create different boxes based on conditional formatting. For example, you can color all part-time employees one color with different information displayed on the box than full-time employees.
In this example, Ned Gorman, manager, has a blue box color and includes information about the number of reports and salaries of people reporting to him. His employees, who are non-managers, are in grey boxes and do not include headcount or budget/total salaries. Ned is in a different box type than his reports.
Enter into edit mode
To edit or create new box types go to Box Types then click on the Edit icon.
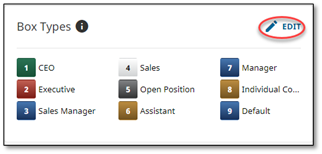
To edit existing box types, hover over the box to be edited and select Edit. You are able to delete boxes if you would like to exclude any box types no longer in use.

- To add a new box type, click on “New Box Type”
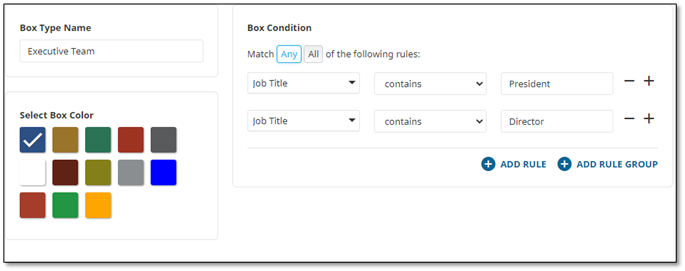
- Add the Box Type Name.
- Select Box Color for this Box Type. If additional box colors are needed, you can add them using Styles.
- Use the Box Condition button to define when this Box Type should be applied to the chart’s employee boxes.
In this example, the administrator wants to color all the boxes for the employees who are in the executive team blue. Anyone in the company whose title contains the words president or director should be included in this team. The configuration below adds a rule to find anyone with “President” in the title and a rule to find anyone with “Director” in the title. The rule uses the “Any” condition to find either president or director.
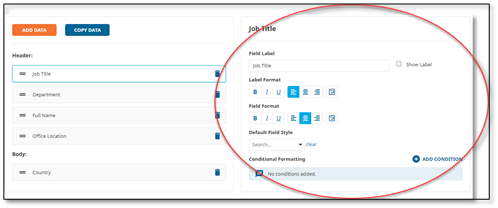
5. Under Field Properties, you will use the Add Data button to begin adding the Information you would like to display on the face of the box for each employee. The following information can be added:
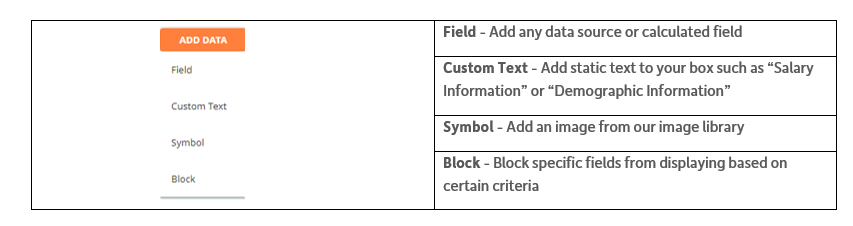
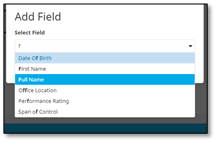
Field: When selecting “Add Field“, a new window will be displayed where you can select from a list of data file fields or calculated fields. Select the field you would like to add to the chart box then click the Add button.
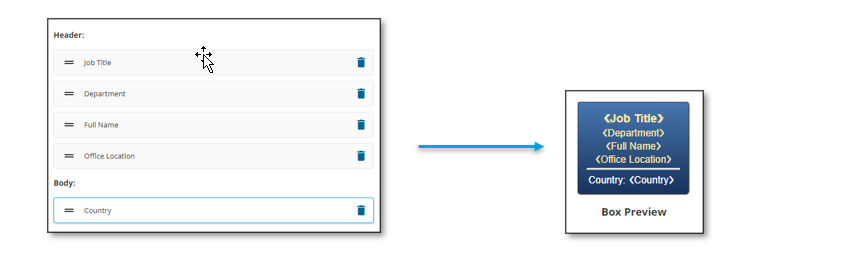
Drag and drop fields in the correct order and placement. The header will display towards the top of the box and adding fields to the body will create a solid line on the box and display the field under the line:
Formatting Field Labels and Cells
You can change the following format properties for each field in a box:
- Field label
- Field style
- Text alignment and word wrapping
- Number formatting
To change the formatting of the field, click on the field. To the right, a panel will open and allow you to make changes.